← All work · Case 06
Couture28
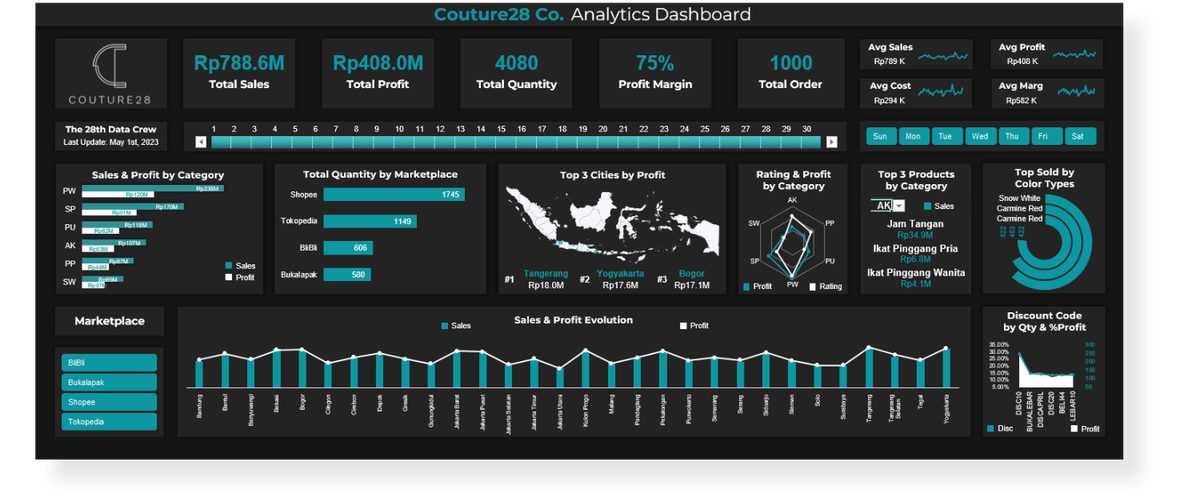
Five years of marketplace sales data and no view of which categories, cities or channels actually made money.
What I did
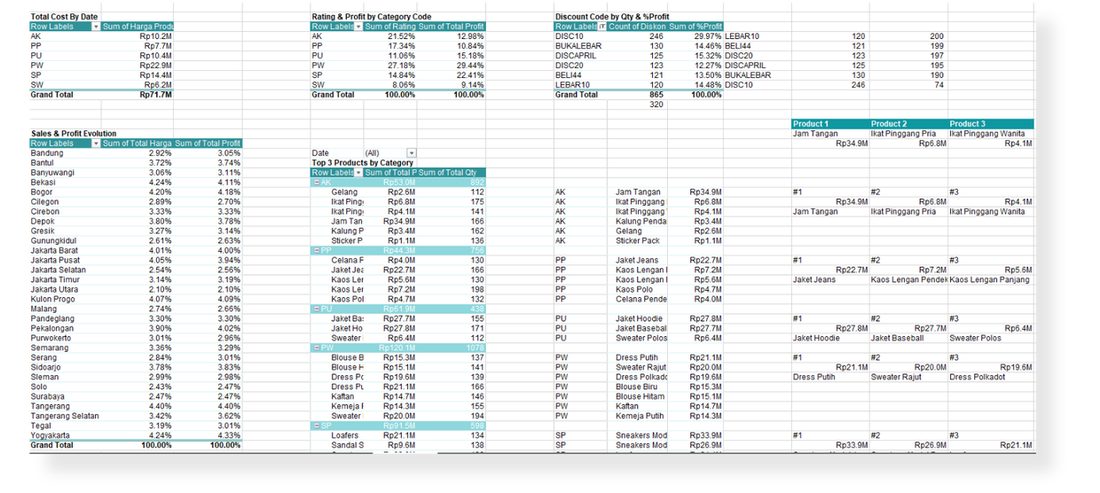
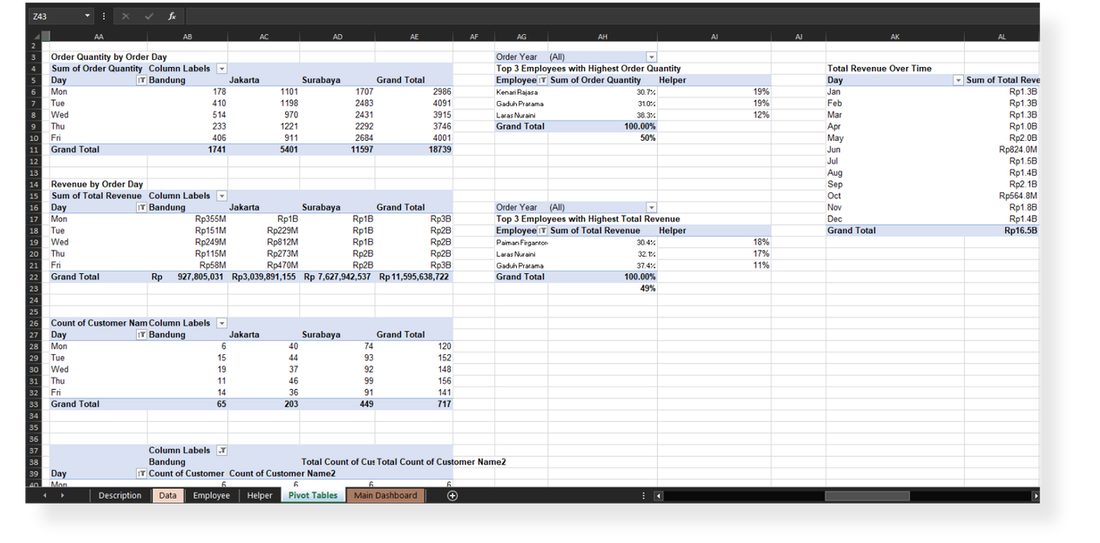
Cleaned and restructured the dataset, built pivot analysis by category, city, colour and marketplace, then put dashboards on top. VBA automated the repeating steps with error handling and modular code, so the analysis could be re-run on new months rather than rebuilt.
What it found
Live, in the browser
The same analysis, rebuilt as something you can actually poke
The originals were Excel dashboards, which means a screenshot is the only way to show them. So I exported the underlying rows and rebuilt the analysis to run in the page. Filter it, click a bar, watch every number recalculate. No charting library: the charts are hand-written SVG, the whole component is about 300 lines, and it works on a phone.
1,000 real order rows from the Couture28 project, 32 KB of JSON, fetched only when the dashboard scrolls into view.
Same component, different dataset
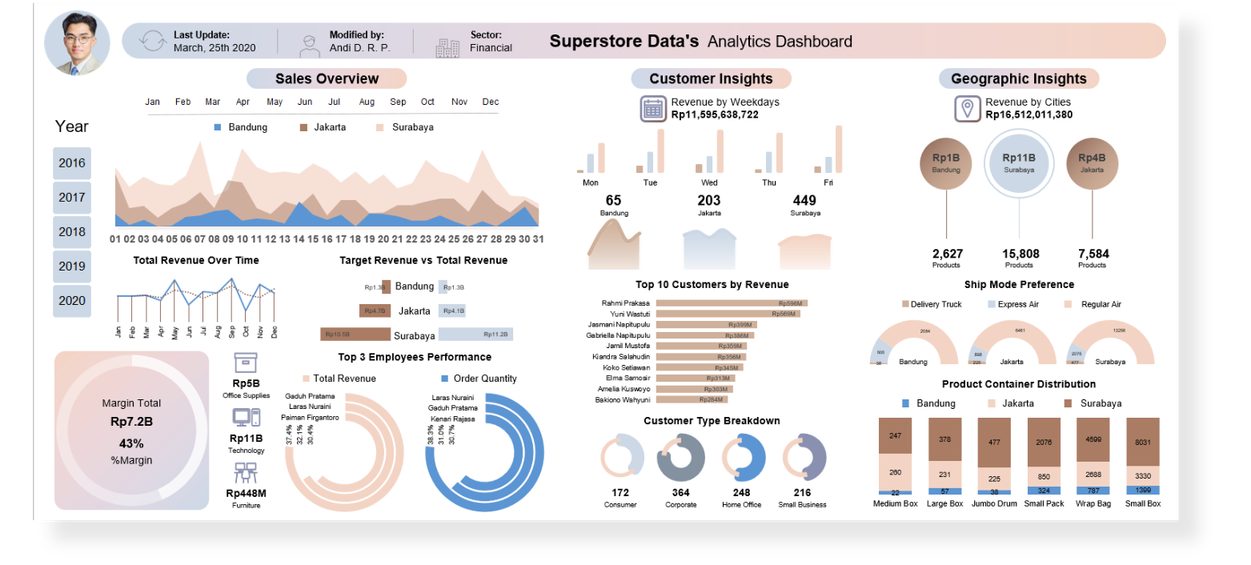
Superstore, 2016 to 2020
The second dataset from the same bootcamp, four years of orders across three cities. It is the identical component with a different JSON file, which is the point: the dashboard does not know anything about either business. The data carries its own filters, breakdowns and labels.
Getting from a spreadsheet to a decision someone will act on is the part most marketers skip. It's the reason I still do my own analysis.