← All work · Case 01
Starlight Group
Paid media across Meta, TikTok and Google Ads, TikTok Shop and live commerce, and the content system across multiple brand accounts in two languages. I also build the storefront.
The budget I own
I own the paid media budget for JJ Gold, one of three retail brands in the group: SGD 6,500 to 7,500 a month, roughly USD 65,000 annualised, across Meta, TikTok and Google Ads.
In July 2026 I scaled that spend 43% month over month and grew revenue 18%, holding blended MER at 12.3×. It was the only one of the group's three brands to grow that month; the other two declined while their spend went up.
Efficiency came down from 14.9× as I scaled. That was a deliberate trade: growth bought with margin, against a floor I wasn't willing to go under.
How I measure it
Blended, not platform-attributed. Total revenue over total ad spend shows the whole commercial result rather than an ad platform's own attribution. I track profit ROAS alongside it because a strong revenue return on a thin-margin product can still lose money.
Profit ROAS is gross profit divided by advertising spend. The public reporting below keeps the ratios and percentage changes while withholding the underlying financial and customer data.
Performance reporting
Profit ROAS improved from 5.68× in July to 6.99× in September 2026. Each reported month finished above the corresponding month in 2025, with gains ranging from 21% to 51%.
What changed
In a separate contract funnel, September cost per contract fell 65% month over month and new-customer acquisition cost fell 63%. I used the reporting to review channel efficiency, testing results and budget allocation with management.
Profit ROAS comparison
JUL–SEPSeptember efficiency
AUG = 100The work
Day-to-day digital marketing across multiple brand accounts in two languages. TikTok Shop and live commerce: event campaigns, short-form video, livestream operations. Paid campaigns on Meta, TikTok and Google Ads against cost-per-result and ROAS targets.
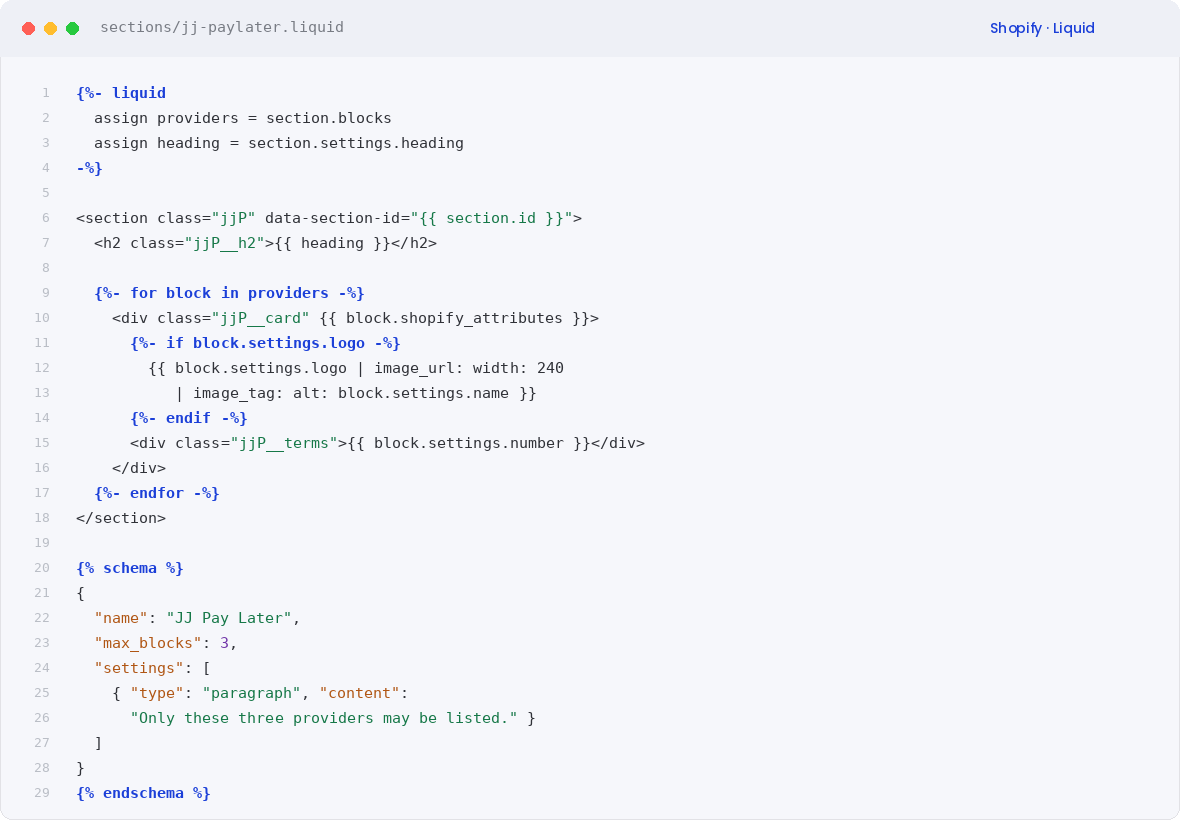
And the storefront: ten schema-driven Shopify Liquid sections, structured data across the site, and an assisted content pipeline that drafts against a governed context file rather than a blank prompt.
What I built
The storefront, in code
Custom sections written to drop into the theme, not a page builder. Every section exposes settings, blocks and presets, so the team edits copy in the Shopify editor instead of asking me.
Constraints that must not drift are written into the section schema as editor notes rather than left to memory. Sections inherit the theme's font and colour variables where they exist and fall back cleanly where they don't. Each one ships with a README so a future developer can pick it up without me.
Chain Finder, live
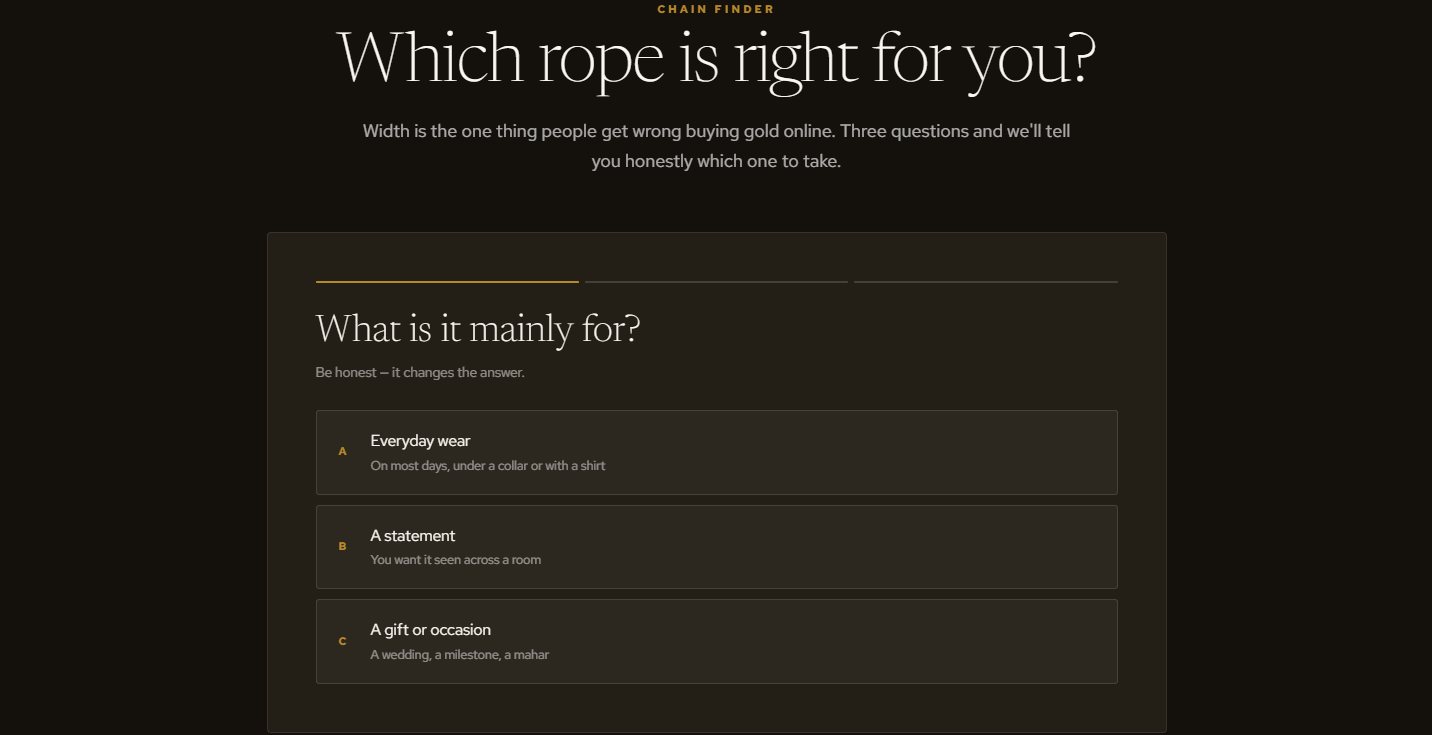
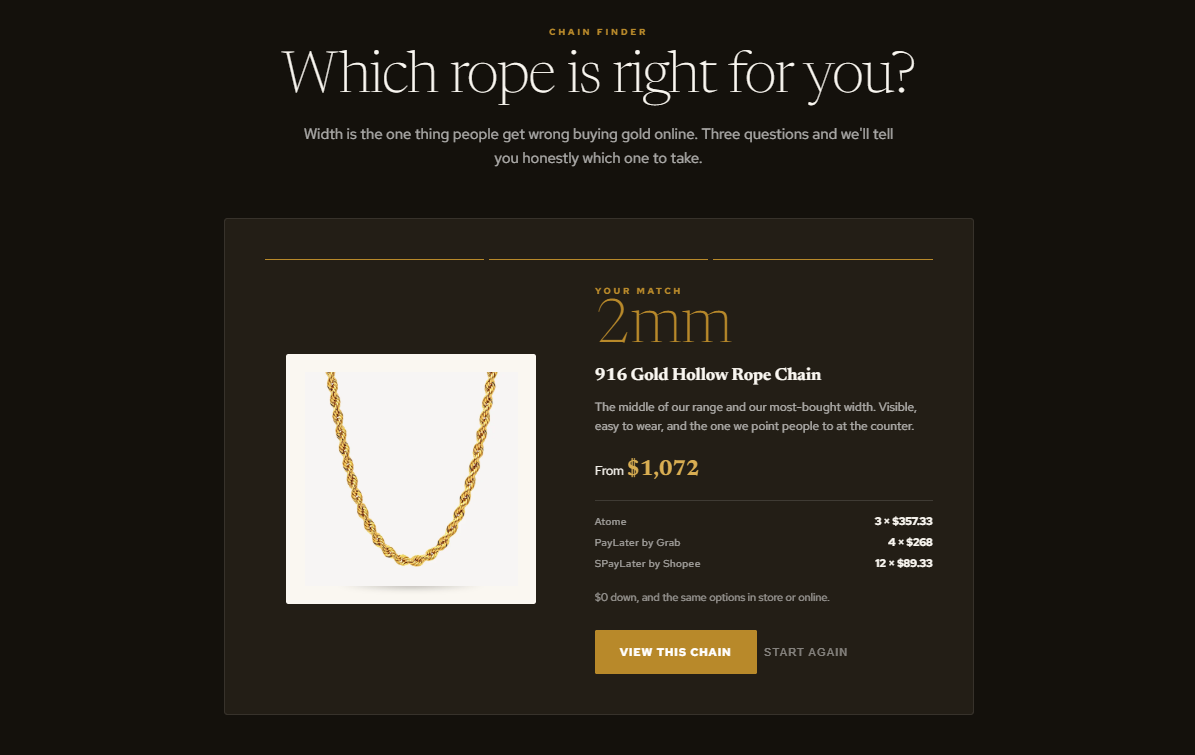
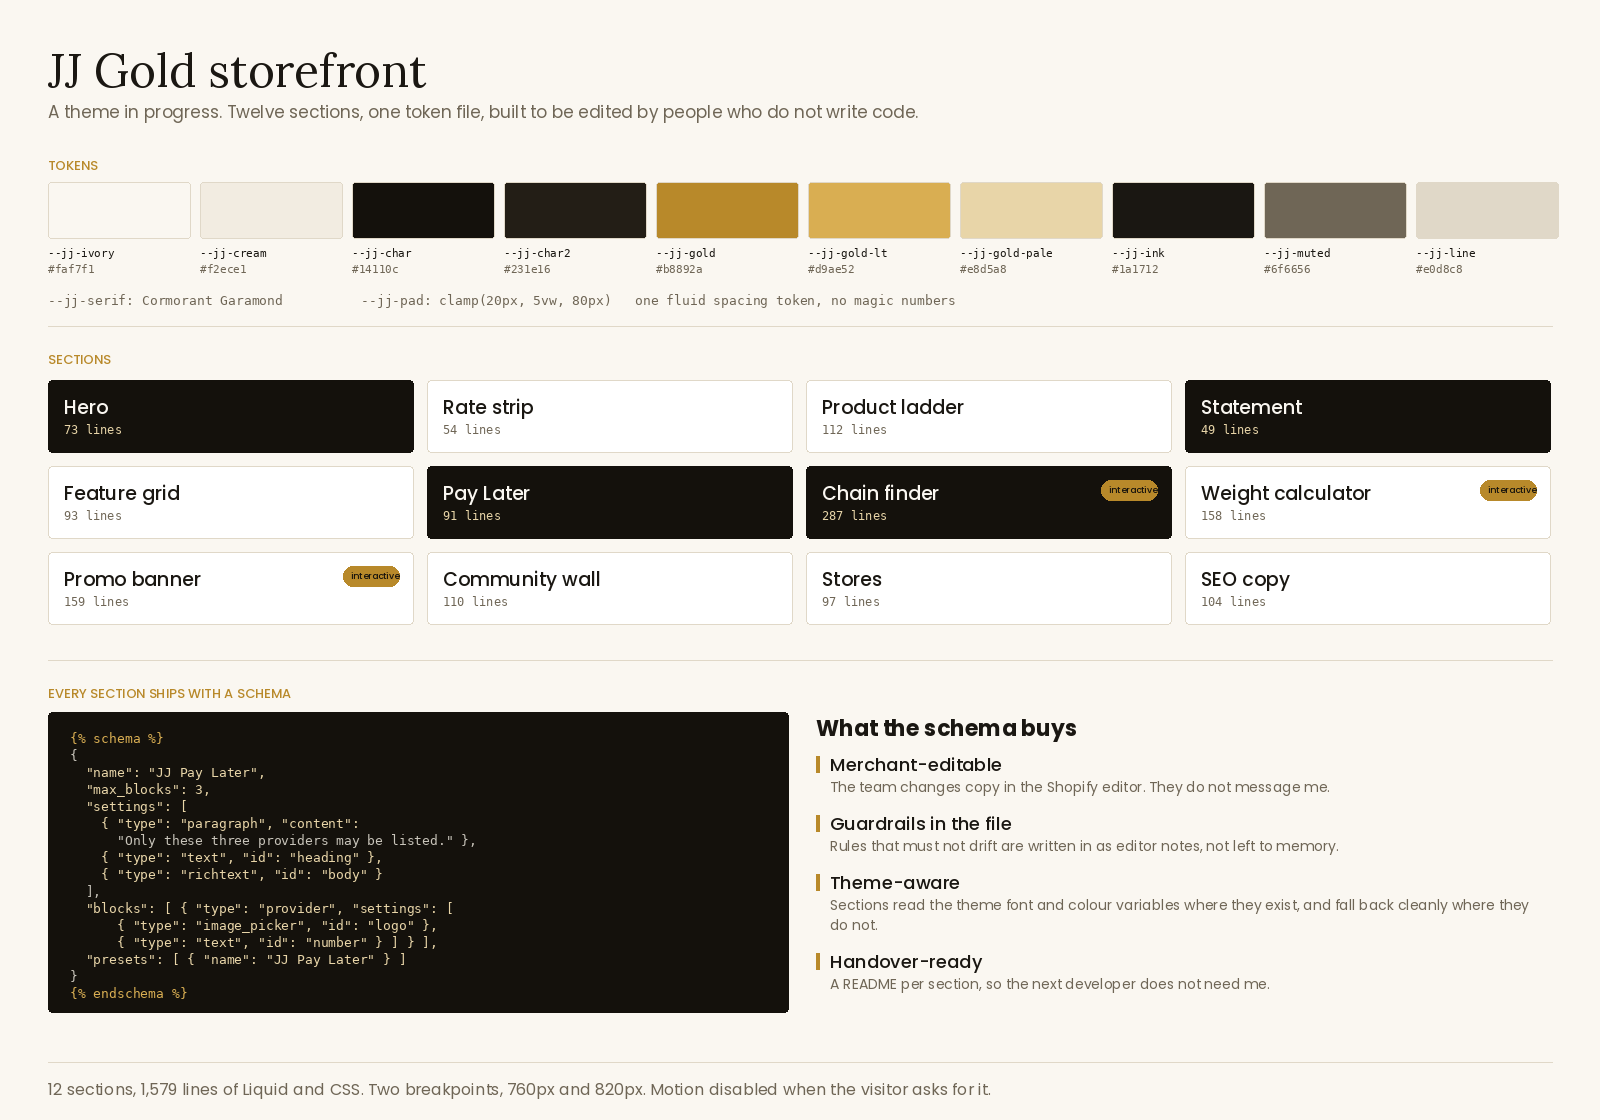
Three questions, one recommendation. 287 lines of Liquid, CSS and vanilla JavaScript, no plugin.
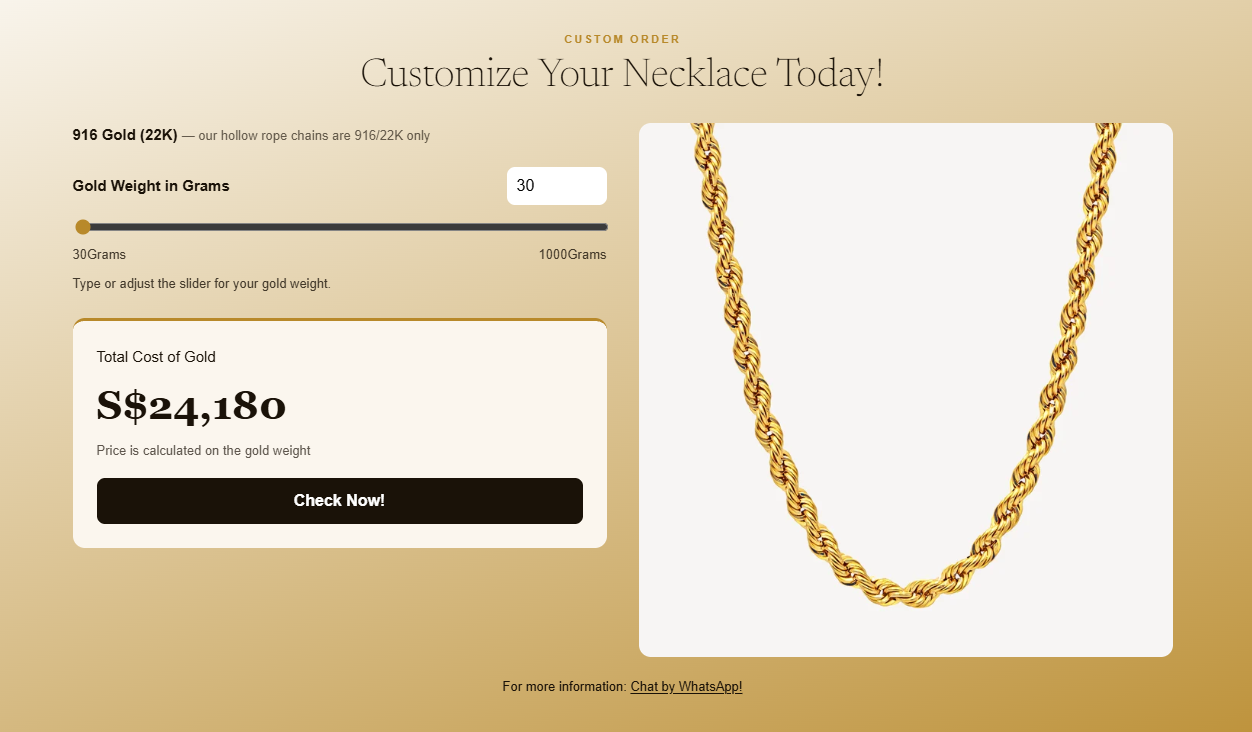
Weight calculator
A slider and a number field that stay in sync, reading the live per-gram price straight off a Shopify product. Updating the daily gold rate is a price edit in admin, not a code change.
 1var pricePerGram = {{ p.price | default: 0 }} / 100;
 2
 3function clampWeight(v) {
 4  var min = parseFloat(slider.min), max = parseFloat(slider.max);
 5  v = parseFloat(v);
 6  if (isNaN(v)) v = min;
 7  return Math.min(Math.max(v, min), max);
 8}
 9
10function update() {
11  var weight = clampWeight(input.value);
12  slider.value = weight;
13  input.value = weight;
14
15  priceEl.textContent = fmt(weight * pricePerGram);
16  variantInput.value = variantId;
17  qtyInput.value = weight;  // quantity = grams, so cart total = price/gram × grams
18}
The section reads the product's live price and writes grams straight into the cart quantity, so total cost is price-per-gram times grams with nothing hardcoded.
On what's published here. This public version shows my scope, method and normalized results. It excludes monthly revenue, gross profit, spend, customer counts, pricing, commercial strategy and account screenshots.